Your Dashboard Is Not an Operating System (Yet): A 5 Layer Framework for App Growth Teams
Your Dashboard Is Not an Operating System (Yet): A 5 Layer Framework for App Growth Teams
If you're running marketing at an iOS subscription app where the team has no room for a bad week, this is for you. The founder doing it all alone, ASA, ASO, creative, paywall. Or the marketing lead with one to four execs splitting paid, organic, and creative. Either way, you have a dashboard problem you can't see from inside it.
Monday morning. You open AppsFlyer, the ASA console, RevenueCat, your spreadsheet. ROAS is soft on two ad groups. Trial-to-paid wobbled, probably noise. One keyword's CPT crept up but rank held, so you'll circle back. You post "keeping an eye on it" in Slack and move on. By Friday: the soft ROAS was three days of overspend on a fatigued creative, the wobble was a paywall variant that shipped without a clean A/B, and the keyword you'd circle back to has been bleeding all week.
That's not an operating system. That's a reporting graveyard. The difference is the difference between reacting in seven days and reacting the same afternoon.
By the end of this piece you'll have a definition that separates reporting dashboards from operating systems, the 3 reasons most growth dashboards stop at reporting, a 5-layer framework, and a 7-step build plan.
What Is a Dashboard Operating System?
A dashboard operating system is a structured, real-time view of your most critical metrics, organized by ownership, thresholds, and action links, that drives daily decisions instead of weekly retrospectives.
Most teams don't have one. They have charts that describe the past. A reporting dashboard answers "what happened." An operating system, on the other hand, answers "what do we do right now."
For lean teams running ASO, creative-driven demand generation, store conversion optimization, and monetization in parallel, a passive dashboard is expensive in ways that don't show up on the dashboard itself. A CPI spike that sits undetected for seven days is seven days of paid spend buying installs at worse unit economics than your model assumes, and you find out next month when the cohort fails to convert. A trial-to-paid drop that goes unnoticed until Monday is a week of trial starts locked in at the lower rate before anyone touches the paywall.
When we ran onboarding audits with new clients at OWA AI, 96% of them had at least three unseen fails sitting in their dashboards that nobody had caught.
The dashboard didn't fail at reporting. It failed at telling you when to act.
Why Traditional Growth Dashboards Fail
Three structural problems cause most growth dashboards to stop at reporting:
- Metrics without owners. A number on a screen is a curiosity. A number with a name next to it is a responsibility. Most dashboards show metrics in aggregate, so nobody is accountable for moving them.
- No thresholds, no triggers. When everything looks the same shade of acceptable, nothing gets prioritized. Teams that don't define what "red" means in advance spend meeting time debating whether a metric is a problem instead of fixing it.
- Insight without a diagnostic path. The dashboard shows trial-to-paid is down. Now what, and why? Maybe the wrong audience is getting pulled in before they even install. A new ASA keyword set, a Search tab campaign, or an icon and screenshot refresh that ranks for terms your product doesn't actually serve. Maybe install intent is fine but the screenshots overpromise something the app doesn't deliver. Maybe an onboarding step you added last week is filtering out the users who would have converted. Maybe a paywall price test shipped Tuesday, or a localization update broke the offer in three markets. Without a dashboard that walks you backward to the cause and forward to the response, you sit in the meeting debating theories instead of running the playbook. These aren't technology problems. They're structural problems. The fix isn't a better analytics tool. It's a better architecture.
The 5-Layer Operating System Framework
Growth in a subscription app comes from two levers, and a working dashboard has to show both:
Volume. How many users enter and progress through each funnel stage.
Conversion. The rate at which they move from one stage to the next.
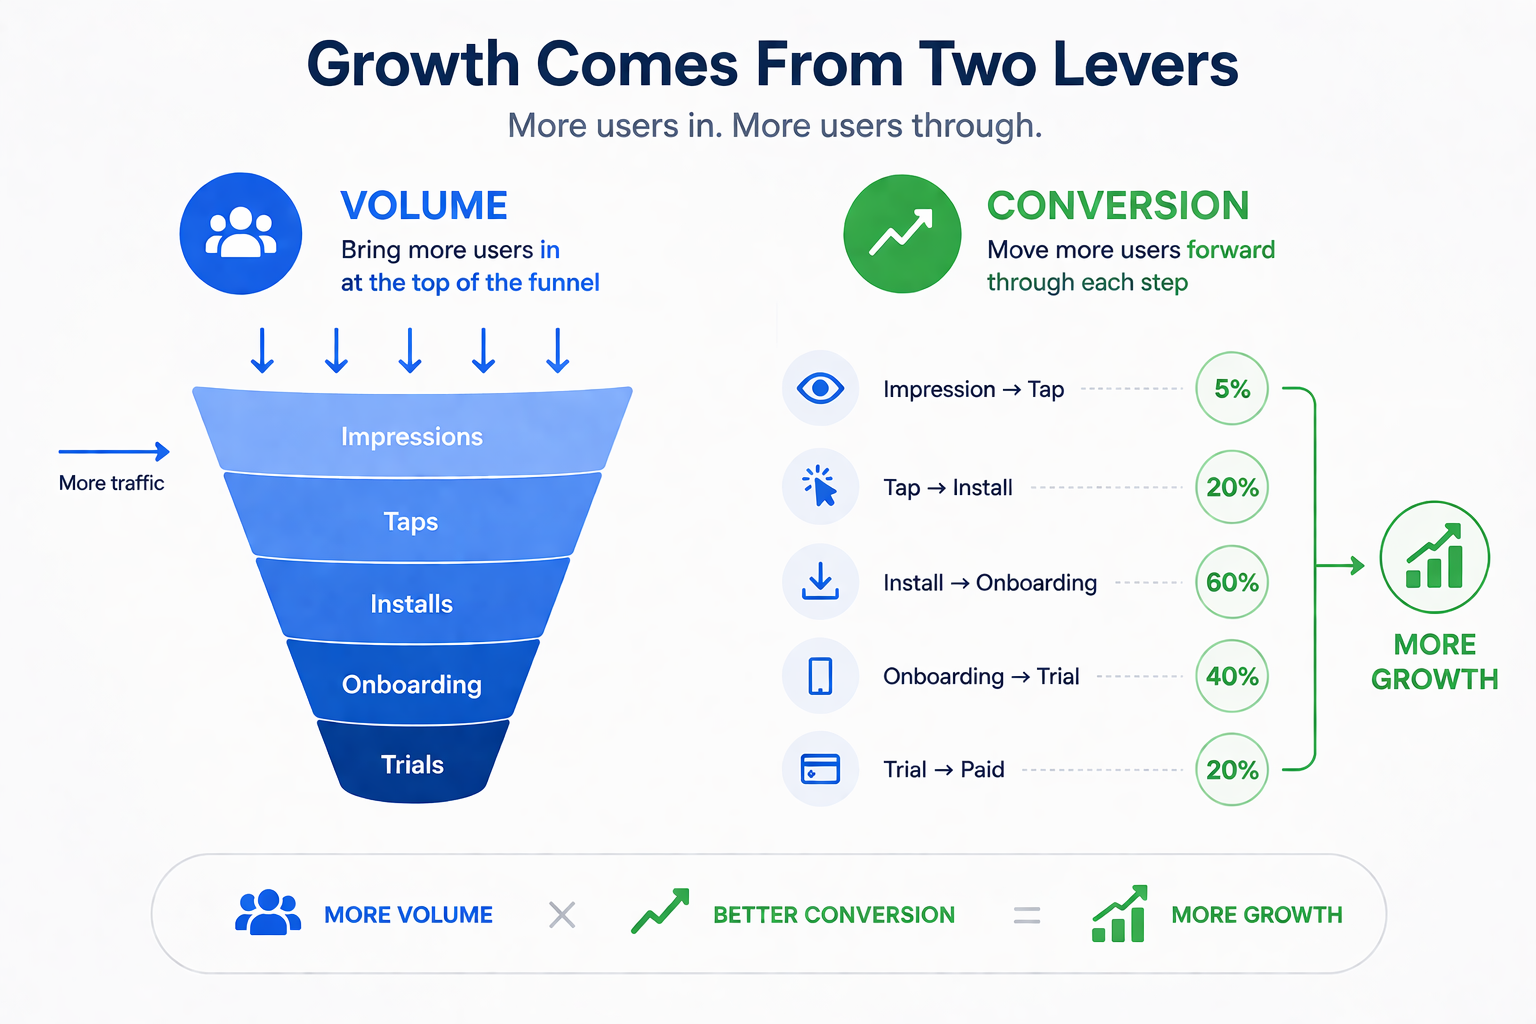
More users poured into a leaky funnel that grows nothing. Better conversion on a starved funnel grows nothing either. Most teams pull one lever instinctively (usually whichever one they own) and miss when the other is the actual bottleneck. The operating system keeps both visible at once and tells you which lever is failing today.
The five layers below are how that gets built.
Layer 1: North Star Metric
One primary metric for your core goal. For subscription apps, usually net revenue per install or 30-day retention. For earlier-stage apps, Day-7 retention or trial start volume.
Singular by design. Every metric in the layers below has to explain how it moves the North Star, through volume, through conversion, or through both. If it can't, it isn't part of the operating system. It's a curiosity living in a secondary report.
Layer 2: Outcome Metrics (the volume lever)
Outcome metrics are absolute counts at each stage of the funnel. They answer one question: how many users made it this far?
The funnel runs from impressions through taps, downloads, and installs (downloads are App Store download taps, installs are downloads where the user actually opened the app), then onboarding starts, onboarding finishes, paywall views, trial starts, trial conversions, retained users at D7 and D30, and renewals.
Read left to right and you see the volume of users at every stage of the journey. Read top to bottom over time and you see whether each stage is growing, holding, or shrinking. This is the volume lever. It tells you whether the machine is fed.
What it doesn't tell you is where users drop off between stages. A stable install count next to a falling trial conversion count means a leak opened somewhere in the middle, but the counts alone won't say where. That's Layer 3's job.
Layer 3: Operational Metrics (the conversion lever)
Operational metrics are the conversion rates between adjacent stages in Layer 2. Each rate answers a single question: of the users who reached stage A, how many made it to stage B?
- Tap-Through Rate (taps ÷ impressions)
- Install Rate (installs ÷ taps, the share of product page taps that became opened installs)
- Open Rate (opens ÷ installs)
- Onboarding Start Rate, Onboarding Finish Rate
- Paywall View Rate, Paywall Conversion Rate
- Trial Conversion Rate, Retention Rate, Renewal Rate
Every rate is a leak point you can fix. Together, they're the conversion lever.
Layer 3 is also where the diagnostic logic of the operating system lives. When a count in Layer 2 drops, the cause is sitting in a Layer 3 rate upstream of it. You walk the rates backward until the broken one appears.
Say install-to-paid conversions are down. The cause is somewhere between install and paid, so you check what changed in that stretch of the user journey. Walk the rates: Paywall Conversion Rate, Paywall View Rate, Onboarding Finish Rate, Onboarding Start Rate, Install Rate. The first broken rate names the exact stage to fix. A drop between Install Rate and Onboarding Finish Rate means the leak is in onboarding, the playbook is the onboarding playbook, the owner is the lifecycle lead. You don't debate it in Monday's meeting. You read the broken rate off the dashboard and run.
Layers 2 and 3 together also answer the lever question. If conversion rates are healthy across the funnel but trial conversions aren't growing, the bottleneck is volume, and the move is at the top of the funnel: more impressions, more taps, more installs. If volume is healthy but a rate is bleeding, the bottleneck is conversion, and the move is to fix the leak. The dashboard surfaces both diagnoses simultaneously, which is the structural reason it produces faster decisions than a reporting view ever can.
Layer 4: Ownership and Thresholds
Every metric in Layers 2 and 3 gets two things: a name and a performance band.
Ownership removes ambiguity. On lean teams, one person typically owns several adjacent stages. The ASO and ASA lead owns Impressions through Install Rate. The lifecycle lead owns Open Rate through Paywall View Rate. The monetization lead owns Paywall Conversion through Renewal. What matters is that ownership is explicit and adjacent stages have a single neck to grab.
Performance bands replace interpretation with protocol:
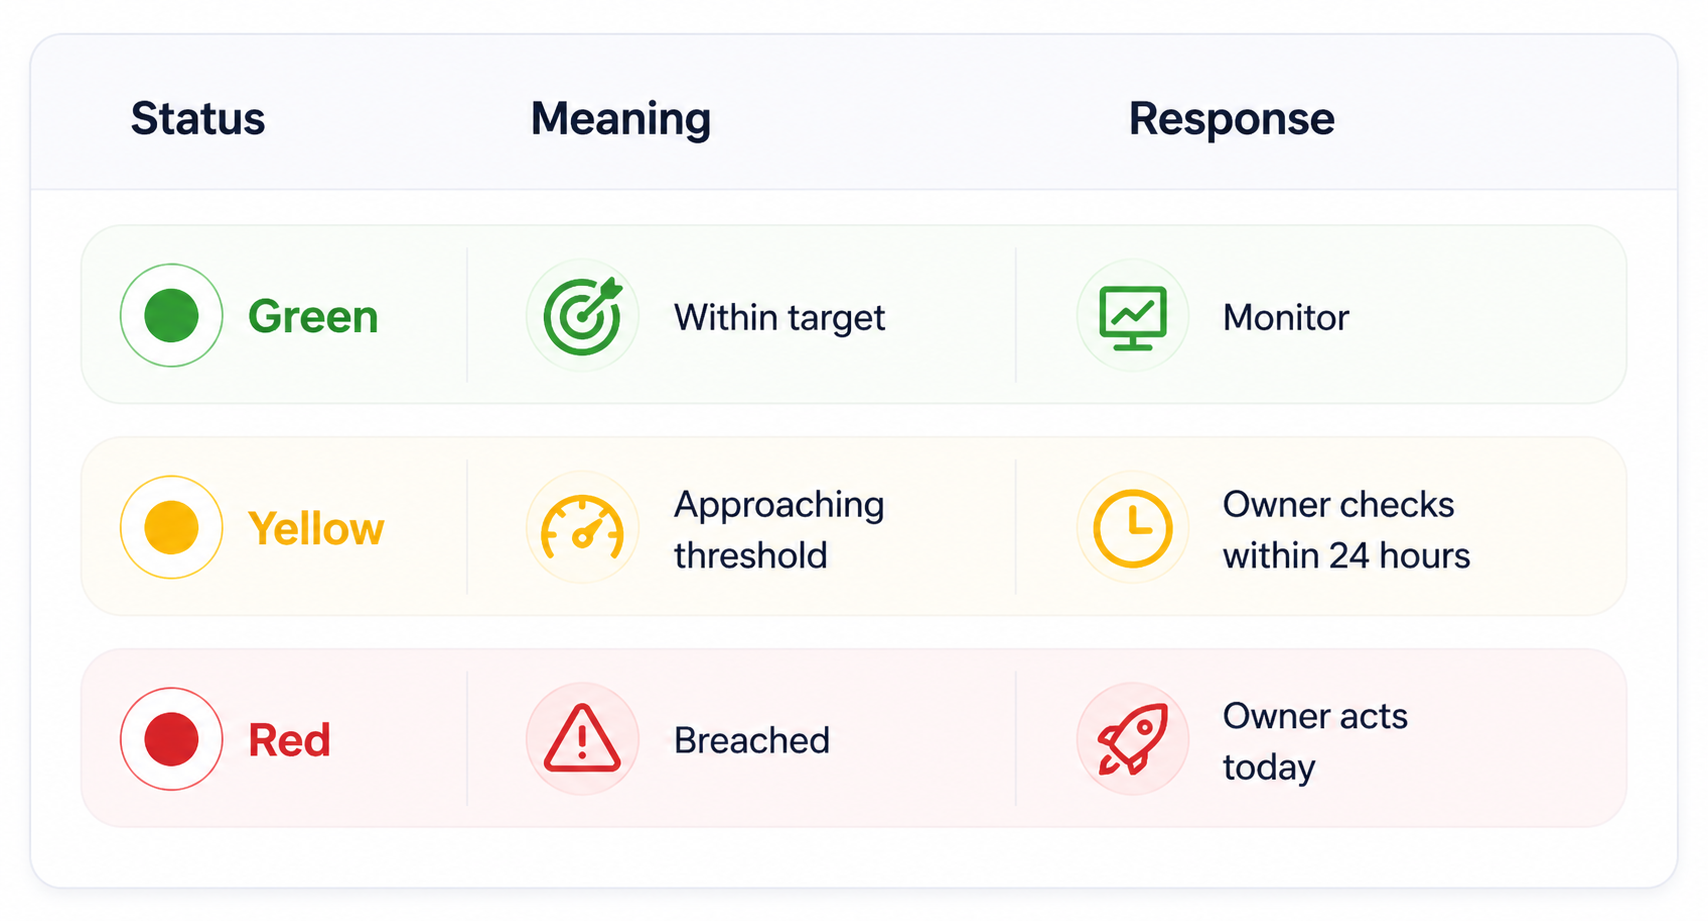
Defining these bands in advance is the structural change that turns a dashboard into a decision engine. Red isn't a decoration. Red means today, not Monday.
Layer 5: Action Links
A red metric without a next step is just an alarm nobody silences. Layer 5 closes the loop between insight and execution.
For each Layer 2 and Layer 3 metric, define three things: the playbook (the standard response when the metric goes red), the tool (ASA console, ASO tool, MMP, paywall config, lifecycle platform), and the escalation path (when the call moves from one owner to the team).
Because the operating system covers both levers, the playbooks split along the same line.
Conversion-side example: Paywall Conversion Rate drops below 4% for three consecutive days → Owner reviews paywall variants live in the last 14 days → Checks pricing, contextual triggers, and localization for affected markets → Kills variant or swaps design within 48 hours.
Volume-side example: Installs drop 20% week-over-week with downstream rates stable → Owner reviews ASA spend and keyword performance → Checks ASO rank shifts on NorthStar keywords → Evaluates creative TTR on fatigued ad groups → Proposes bid, keyword, or creative move within 48 hours.
When the action path lives inside the dashboard, the time from red metric to first response compresses from days to hours, on either lever.
Real Outcomes From Operating System Dashboards
Here is what shifts when growth teams move from reporting dashboards to operating systems. This is the operating logic we built into OWA AI, so the examples below reflect how the framework behaves in a live environment rather than how it sounds in theory.
Monday meetings drop from 60 minutes to 25 minutes. When everyone walks in seeing the same green, yellow, and red states, the alignment debate disappears. Green metrics get a glance. Yellow and red go straight to the owner and the next step. The meeting becomes execution-oriented, not information-oriented.
Problem detection moves from 7 days to same-day. A ROAS drop that used to sit invisible until the weekly review now triggers a yellow status within hours. The owner checks CPT trends and creative TTR, and adjusts if warranted, before the next morning instead of the next Monday.
New team members align faster. The operating system dashboard becomes Day 1 orientation. A new ASO specialist or UA manager sees what the team watches, who owns what, and what red means, without shadowing meetings for two weeks to absorb it.
Decisions become traceable. Every red metric triggers a documented response: bid adjusted, creative swapped, paywall variant launched. Those responses accumulate into a decision log that informs future threshold calibration and turns retrospectives from vibes-based into evidence-based.
[Screenshot: OWA AI dashboard showing metrics. Caption: "The operating system in live mode. Each metric carries an owner, a threshold state, and a defined next step, so a red ROAS flag on Tuesday morning produces a bid review by Tuesday afternoon, not a discussion the following Monday."]
Why This Is an Unfair Advantage for Small Growth Teams
Large companies have operations teams whose entire job is maintaining alignment. You have three to five people covering paid UA, ASO, creative, and analytics simultaneously, sometimes the same person covers two of those.
Your competitive advantage is not budget. It is speed. But speed requires clarity, and clarity requires structure.
An operating system dashboard gives a five-person growth team the coordination capacity of a fifteen-person team, not because it automates decisions, but because it eliminates the friction that slows them down. No Slack spirals about which number is correct. No meetings spent building shared context that should already exist. No week-long delays between a metric moving and someone acting on it.
This matters particularly for ASO and Apple Search Ads integration, where organic and paid signals feed each other continuously. A keyword's organic rank improvement is a signal to reduce paid bids on that term. A paid conversion rate drop on a specific keyword segment is a signal to review the corresponding store listing. If these signals live in separate tools with no shared operating layer, the feedback loop that makes integrated strategy work never closes.
How to Build Your First Operating System Dashboard
Start minimal. A five-metric operating system is more useful than a thirty-metric reporting dashboard.
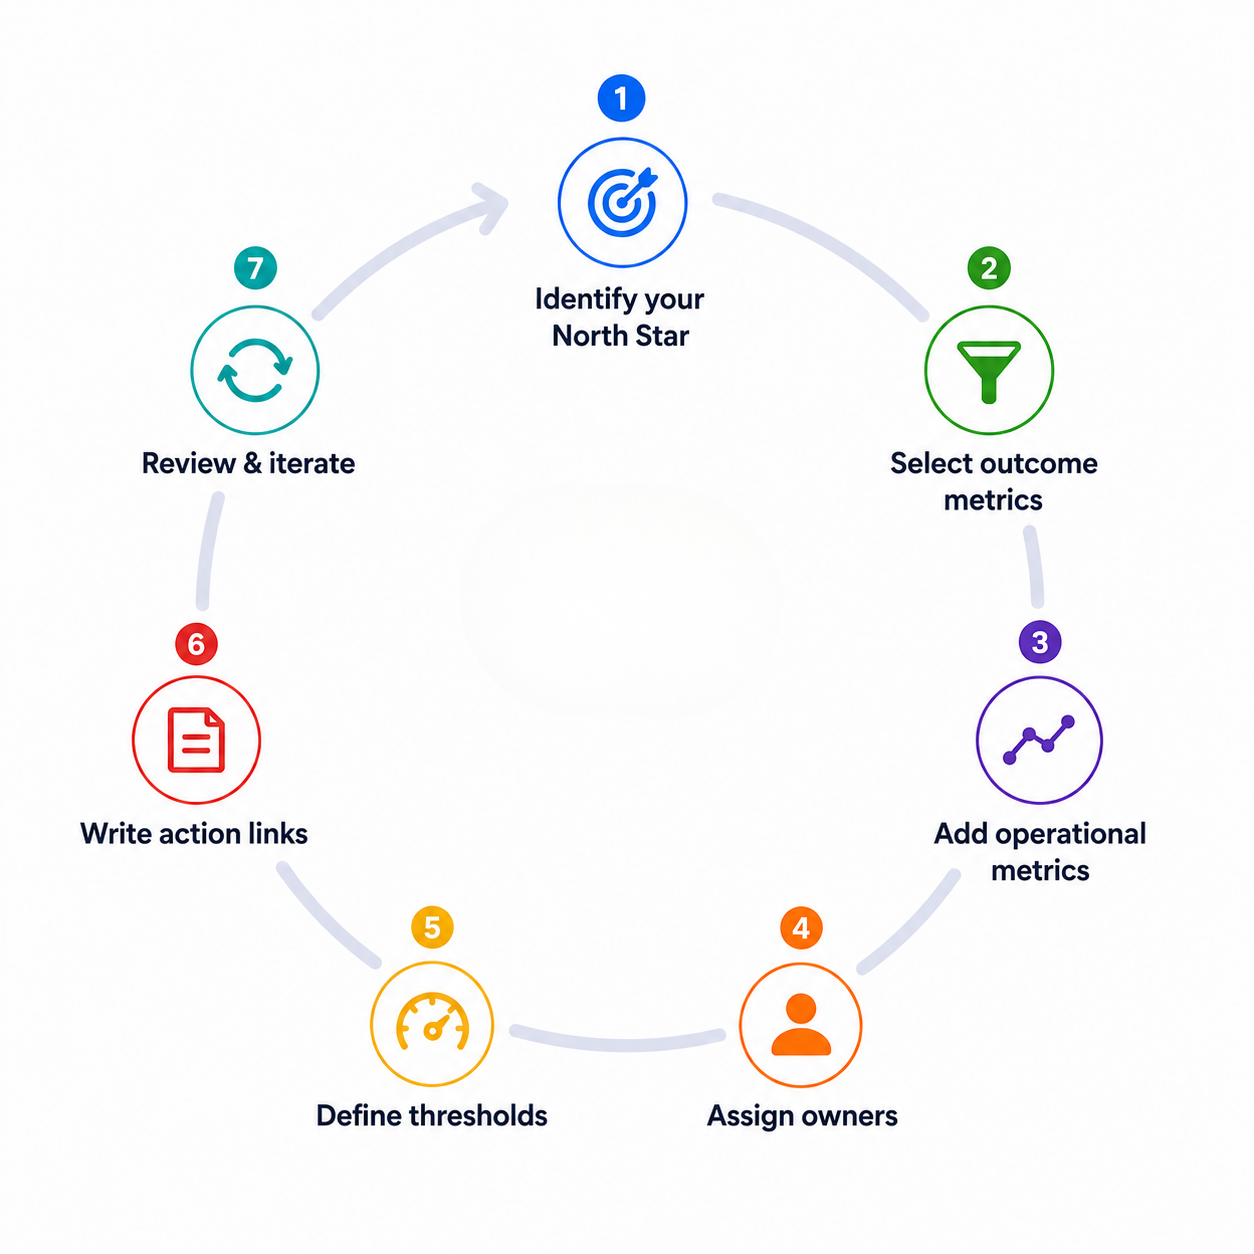
Step 1: Identify your North Star. For most subscription apps, this is 30-day net revenue per install. If you do not have reliable MMP attribution yet, Day-7 retention is a strong proxy.
Step 2: Select three outcome metrics. Trial start rate, trial-to-paid conversion rate, and ROAS cover the full funnel for most subscription app teams. Add or substitute based on your stage.
Step 3: Add two to three operational metrics. TTR and average CPT per campaign segment are high-signal operational metrics for any team running Apple Search Ads. Organic rank for your top five NorthStar keywords covers the ASO side.
Step 4: Assign every metric to an owner. One name. If your team is small and one person owns multiple metrics, that is fine , what matters is that ownership is explicit.
Step 5: Define thresholds. Set green/yellow/red bands based on your historical performance data. If you do not have enough history, start with directional rules ("red = more than 15% drop week-over-week") and calibrate after 60 days.
Step 6: Write the action links. For each metric, write three lines: what the owner does when it goes yellow, what they do when it goes red, and when it escalates. This does not need to be elaborate. A shared doc linked from the dashboard cell is sufficient.
Step 7: Review and iterate. Run the operating system for four weeks. Which thresholds triggered false alarms? Which metrics moved without triggering a response? Adjust bands and action links accordingly.
Frequently Asked Questions
What is the difference between a reporting dashboard and an operating system dashboard?
A reporting dashboard shows historical performance data , what happened over a defined period. An operating system dashboard combines real-time metrics, defined ownership, performance thresholds, and action links to drive decisions today. The structural difference is that an operating system assigns a response to every metric state, not just a visualization.
Which metrics should a mobile app growth team track in their operating system dashboard?
For subscription apps running Apple Search Ads and ASO, a high-signal operating system typically includes: ROAS (MMP revenue ÷ ASA spend), trial start rate, trial-to-paid conversion rate, average CPT by campaign segment, TTR (taps ÷ impressions), and organic keyword rank for NorthStar keyword groups. The exact set depends on your growth stage and primary acquisition channel mix.
How do you define thresholds for a growth dashboard?
Start with 60 days of historical data and calculate the mean and standard deviation for each metric. Green is within one standard deviation of the mean. Yellow is one to two standard deviations from mean. Red is more than two standard deviations. If you lack historical data, use directional rules , "red = more than 15% week-over-week decline" , and refine after your first full quarter of operating system data.
How does a dashboard operating system improve team alignment?
Alignment breaks down when teams disagree on which numbers are correct and what they mean. An operating system resolves both problems by establishing a single source of truth for every metric and defining what each performance state requires , so conversations move from "what does this mean" to "here is what we are doing about it."
How does this apply specifically to Apple Search Ads and ASO management?
ASO and Apple Search Ads generate interdependent signals, paid conversion data informs organic keyword prioritization, and organic rank movement changes the economics of paid bids. An operating system dashboard that surfaces both sets of signals in one view, with shared ownership and thresholds, is the infrastructure that makes integrated ASO and Apple Search Ads strategy executable rather than theoretical.
Conclusion
A dashboard that gets opened on Monday and closed without action is not a dashboard problem, it is an architecture problem. The shift from reporting graveyard to operating system is not a technology upgrade. It is a structural one: metrics with owners, thresholds that trigger responses, and action links that make the next step obvious.
For small growth teams competing against larger organizations, this structure is not a nice-to-have. It is how you move faster than teams with ten times your headcount.
At OtherWayAround, this is the kind of infrastructure gap we help growth teams close , building the systems that connect data to decisions across ASO, Apple Search Ads, and the full mobile acquisition funnel. If your current dashboard is a rear-view mirror, the framework above is your starting point.
Join the OWA AI Waitlist. Build the operating layer your dashboard is missing.